
Databox review
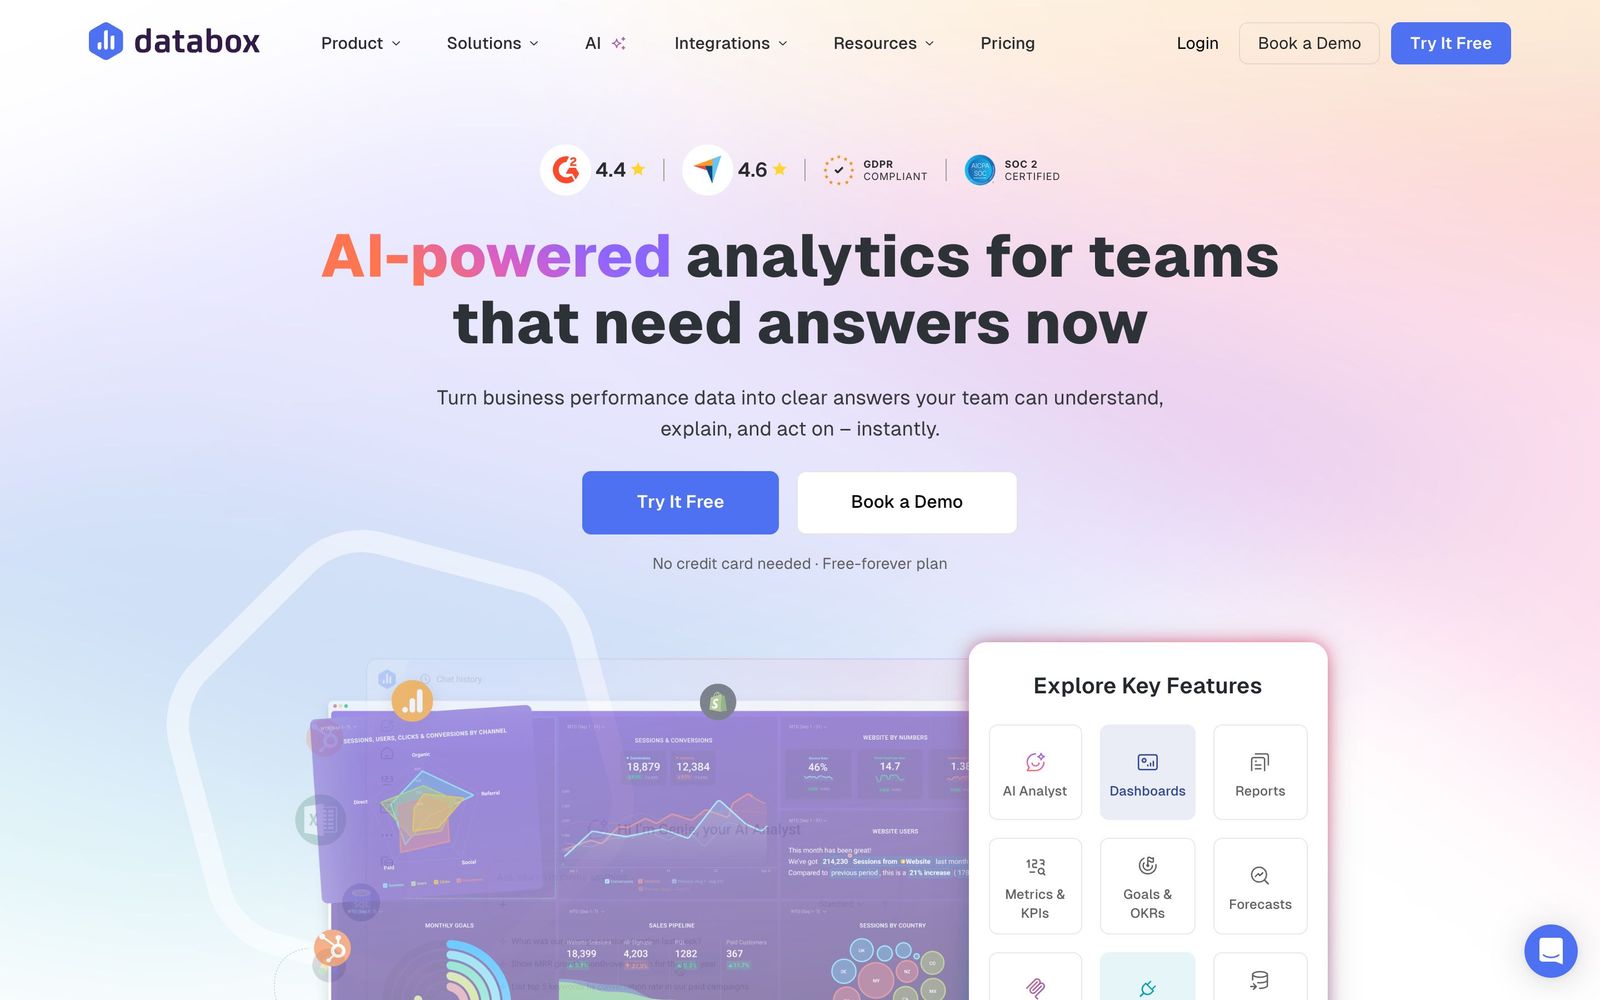
Analytics platform pulling 130+ data sources into dashboards, automated reports, goals, AI-queried metrics.
Best at replacing manual client and team reporting with connected dashboards and scheduled reports; it is not a full BI tool, so heavy data transformation needs live elsewhere.
Pros
- 130+ native integrations plus databases, warehouses, and spreadsheets cover most marketing stacks
- 300+ prebuilt dashboard templates get a usable report live in minutes
- Automated scheduled reports combine live metrics with written context for clients and leadership
- Genie, the AI analytics assistant, answers data questions conversationally
- Goals, benchmarks against similar companies, and metric forecasting go beyond plain dashboards
- A genuine free plan exists for small setups
Cons
- Costs scale with the number of data sources, which surprises growing teams
- Complex data modeling and transformations are limited compared to real BI tools
- Some integrations sync limited historical data, constraining year-over-year views at the start
Databox built its reputation as the tool that ends the monthly screenshot-and-paste reporting ritual, and in 2026 it claims more than 20,000 teams and agencies using it. The platform has expanded well past dashboards into automated reporting, goal tracking, benchmarking, forecasting, and an AI assistant called Genie. This Databox review covers what the platform automates well, what it deliberately does not do, and how it compares to both free and heavyweight alternatives in marketing analytics and reporting.
What Databox actually does
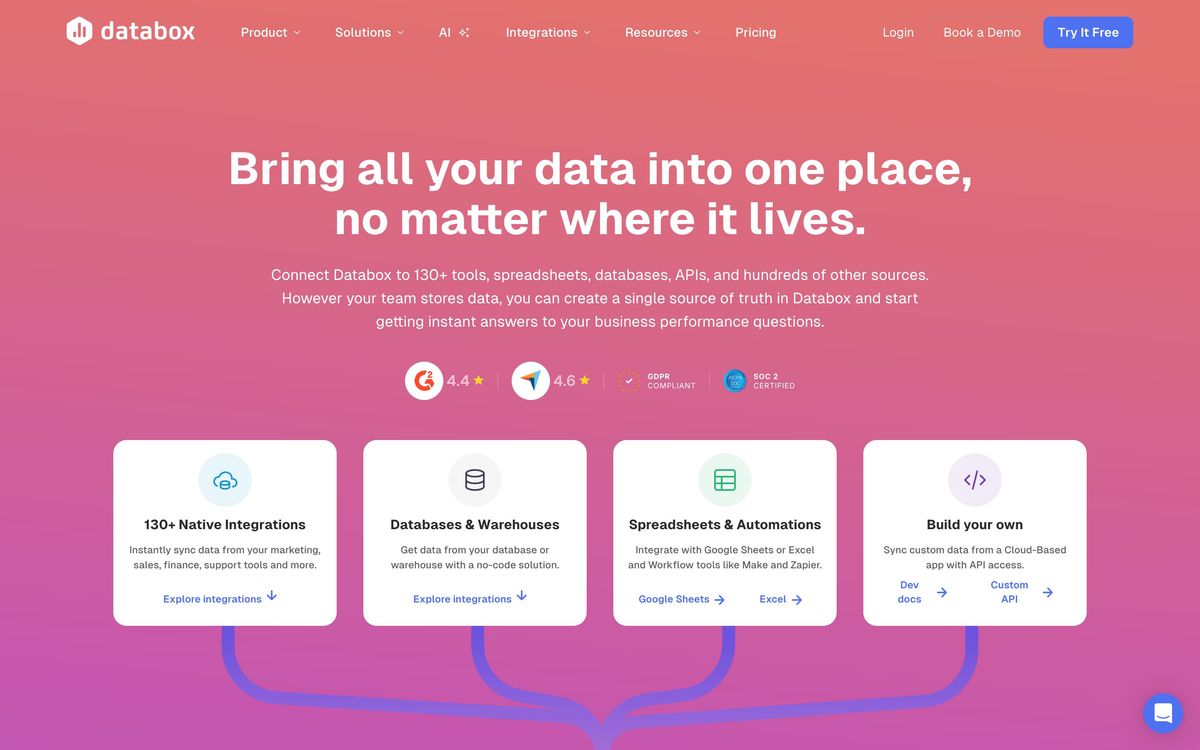
The foundation is connection: 130+ native integrations spanning marketing platforms (HubSpot, Google Ads, Facebook Ads, Shopify, Salesforce), databases and warehouses (BigQuery, Snowflake, PostgreSQL), and spreadsheets. Once sources are connected, you assemble dashboards from prebuilt blocks or start from one of 300+ templates organized by function. SaaS metrics, paid media, sales pipeline, ecommerce.
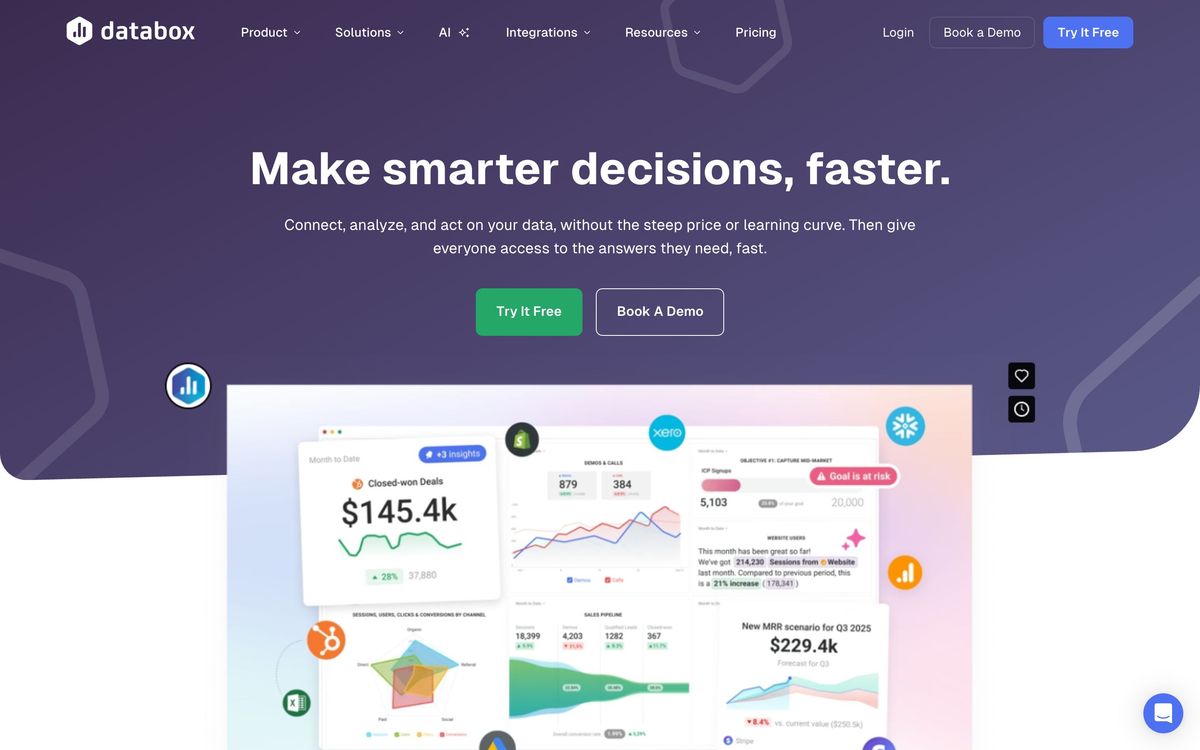
Reporting is where Databox separates from plain dashboard tools. Scheduled reports combine live metrics with visualizations and written commentary, then deliver themselves to clients or leadership on a cadence; the core agency use case. Goals let teams set measurable targets and watch progress automatically; benchmarks compare your metrics against anonymized companies of similar profile, which answers the perennial is-this-number-good question. Metric forecasting projects future performance from historical data. Genie, the conversational AI layer, lets anyone ask questions of connected data in plain language instead of building a custom view. Datasets, the data-preparation module, handles cleaning and merging for teams whose sources do not line up neatly.
Key features
- 130+ integrations across marketing tools, databases, warehouses, and spreadsheets
- 300+ dashboard templates plus a drag-and-drop metric builder
- Automated scheduled reports with live data and written context
- Goals and OKR tracking tied directly to live metrics
- Benchmarks against similar companies and metric forecasting
- Genie AI assistant for conversational data questions
Who it's for
The clearest fit is agencies and consultants automating recurring client reporting; the scheduled-report workflow alone can recover days per month. In-house marketing leaders tracking team KPIs and executives wanting one screen of business health are the other core users. Data teams with heavy modeling needs are not the audience: Databox visualizes and distributes metrics, but complex joins, custom transformations, and deep ad hoc analysis belong in a proper BI stack.
How it compares
Looker Studio is the obvious free alternative: powerful and cost-free, but every connector, refresh quirk, and layout is your problem to build and maintain, and there is no native goals, benchmarks, or report-scheduling experience comparable to Databox's. AgencyAnalytics is the closer commercial rival for agencies specifically; simpler and tightly focused on client reporting, while Databox offers broader analytics features like benchmarking, forecasting, and AI querying. Against full BI platforms like Looker or Power BI, Databox trades modeling depth for speed: live in an afternoon rather than a quarter.
Verdict
Databox occupies a useful middle layer in the 2026 analytics stack: far more automated and maintained than free dashboard tools, far faster to deploy than BI platforms. The benchmark and forecasting features add context most reporting tools lack, and Genie makes the data accessible to non-analysts. The honest tradeoffs are pricing that scales with connected sources, limited historical backfill on some integrations, and a ceiling on data transformation complexity. For agencies and marketing teams whose pain is recurring reporting rather than deep analysis, it is an easy tool to justify, and the free plan makes the evaluation cheap.
Ready to try Databox?
There's a free tier, so you can test it before committing.
More marketers tools like Databox
AgencyAnalytics
4.3Client reporting for marketing agencies: 85+ connectors, white-label dashboards and scheduled reports.
Read AgencyAnalytics review →WhatConverts
4.3Tracks calls, forms, chats and transactions back to the campaign that produced them, in one lead log.
Read WhatConverts review →Survicate
4.1Customer feedback platform for website, in-product, email and link surveys with AI theme analysis.
Read Survicate review →Bïrch
4.0Rule-based automation and bulk campaign management for Meta, Google, TikTok and Snapchat ad accounts.
Read Bïrch review →CallRail
4.0Call, text and form tracking that ties every inbound lead back to the campaign, keyword or page that produced it.
Read CallRail review →Similarweb
4.0Estimated traffic, channel mix and audience data for any website or app, used for competitive and market research.
Read Similarweb review →